| Dataflow diagrams | |
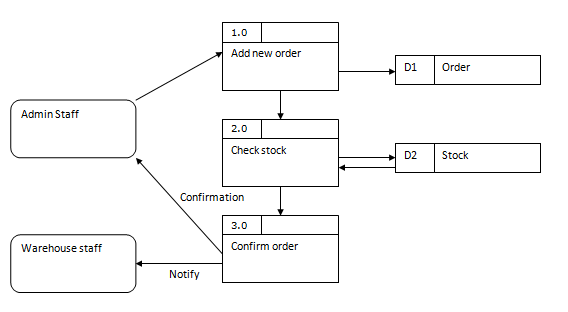
Data flow diagrams, or DFD's, show how information will get processed in a new system. Two advantages DFD's have over flow charts are - 1 DFD's can be broken down into multiple levels. 2. They show the distinction of internal and external parts of the system.
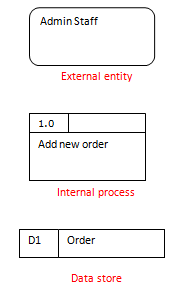
There are three main symbols on a DFD-
External entities represent anything from outside the system to be modeled. This tends to be some form of human input but could be anything such as a sensor or another separate system. Sometimes other external entities need to be involved in a data flow and these should be represented on the diagram, such as letting the warehouse staff know that a new order has been made. Internal process are where something is done with the input given. Add new order, for example, will save the order to the database as well as possibly validating the input. All processing which occurs will tend to happen in a internal process. A data store represents the database or anything else we can store data in such as a file. It is common on DFDs to only put return arrows if data, other than if the transaction was successful, is returned. The flow of data is shown via arrows. You can add a label to the arrow if you wish to express something such as the type or nature of the data to flow. If the flow is obvious then it is better to leave it blank so the diagram does not become cluttered.
The numbering system is very important and allows two things
Internal processes can be split into multiple levels which allow extra detail to be looked at. Consider the process -
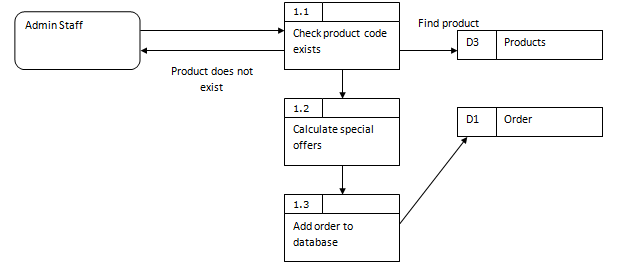
This could be split down by looking at the validation.
The above diagram shows that the add order process actual involves a number of steps, including a error response if a invalid product has been chosen. A new data source, products, has been added which could have been overlooked if the process had not been broken down. The numbering is very important here. Each process starts with the number 1.x to show it is the break down of process one. We call this a level 1 diagram. The original diagram is called a level 0 diagram. If we decided more detail was required for process 1.2 (Calculate special offers) then we would draw a level 2 diagram. The processes would then be numbered 1.2.1, 1.2.2, 1.2.3 and so on. |
|

| Links |
| Flowcharts |
| Design |
 Custom Search


